Visualising intersections and overlaps between data sources
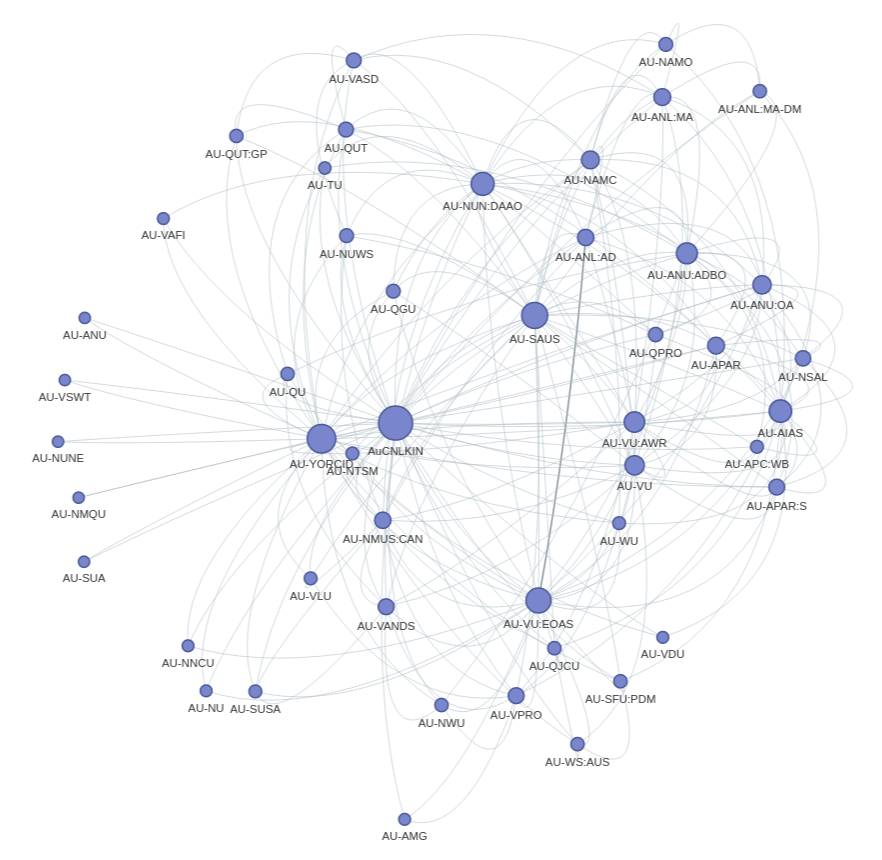
The People & Organisations zone aggregates information from a range of data sources into individual records. In this notebook we'll explore connections between the data sources by creating a network graph and UpSet charts.
Other options
- Run live on Binder (no authentication required)
- Download from GitHub
- View using NBViewer
Additional documentation
Getting help
Cite as
Sherratt, Tim. (2023). GLAM-Workbench/trove-people (version v1.0.0). Zenodo. https://doi.org/10.5281/zenodo.7645059
![]()